Graphing Skill #2: What Type of Graph do I use?
- Due No due date
- Points 7
- Questions 7
- Time Limit None
- Allowed Attempts Unlimited
Instructions
There are several types of graphs that scientists often use to display data. They include:
|
Pie Graphs |
Bar Graphs |
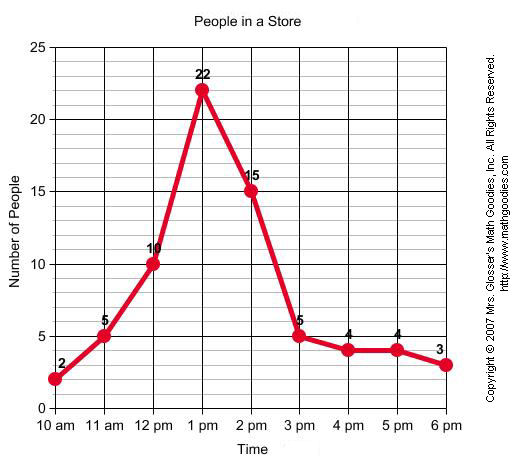
Line Graphs |
Scatter Plots |
 |
 |
 |

|
|
|
|
|
Use these descriptions to help you determine the best graph for the following questions:
Only registered, enrolled users can take graded quizzes